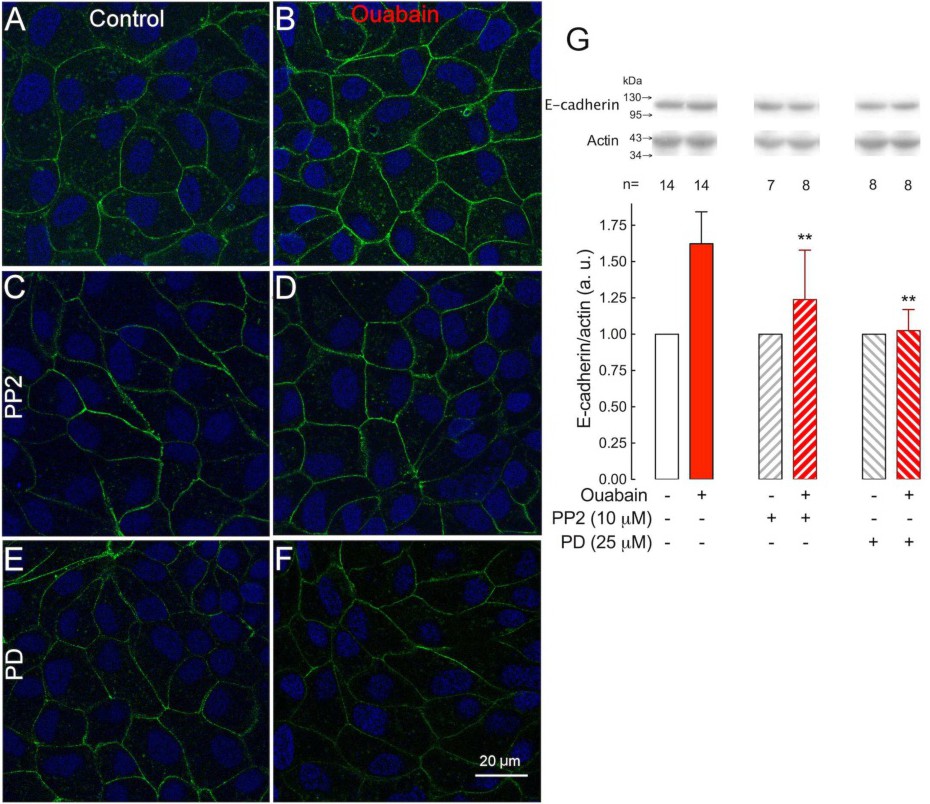
Fig. 5. The increase in E-cadherin is dependent on c-Src and ERK1/2 signaling. Immunofluorescence images show E-cadherin in green and nuclei stained in blue in the single optical slice with the highest fluorescent signal of the chicken fence pattern. (A) Control cells; and (B) cells treated with 10 nM ouabain for 8 h. (C and D) are analogous to (A and B), respectively, except that these monolayers were pretreated for 1 h and throughout the experiment with the c-Src inhibitor PP2. (E and F) are analogous to (A and B), except that these monolayers were pretreated for 1 h and throughout the experiment with PD. (G) Corresponding statistical analysis of the cellular E-cadherin content. White bars correspond to the control cells, and red bars correspond to ouabain-treated cells. Slashed and back-slashed bars correspond to cells treated with PP2 or PD, respectively. *** P<0.001, ** P<0.01, +* p<0.5. The n indicates the number of independent experiments. Data were analyzed by one-way ANOVA of ouabain plus inhibitor-treated cells (slashed and back-slashed red columns) vs. ouabain-treated cells (red column).